CIE CLI
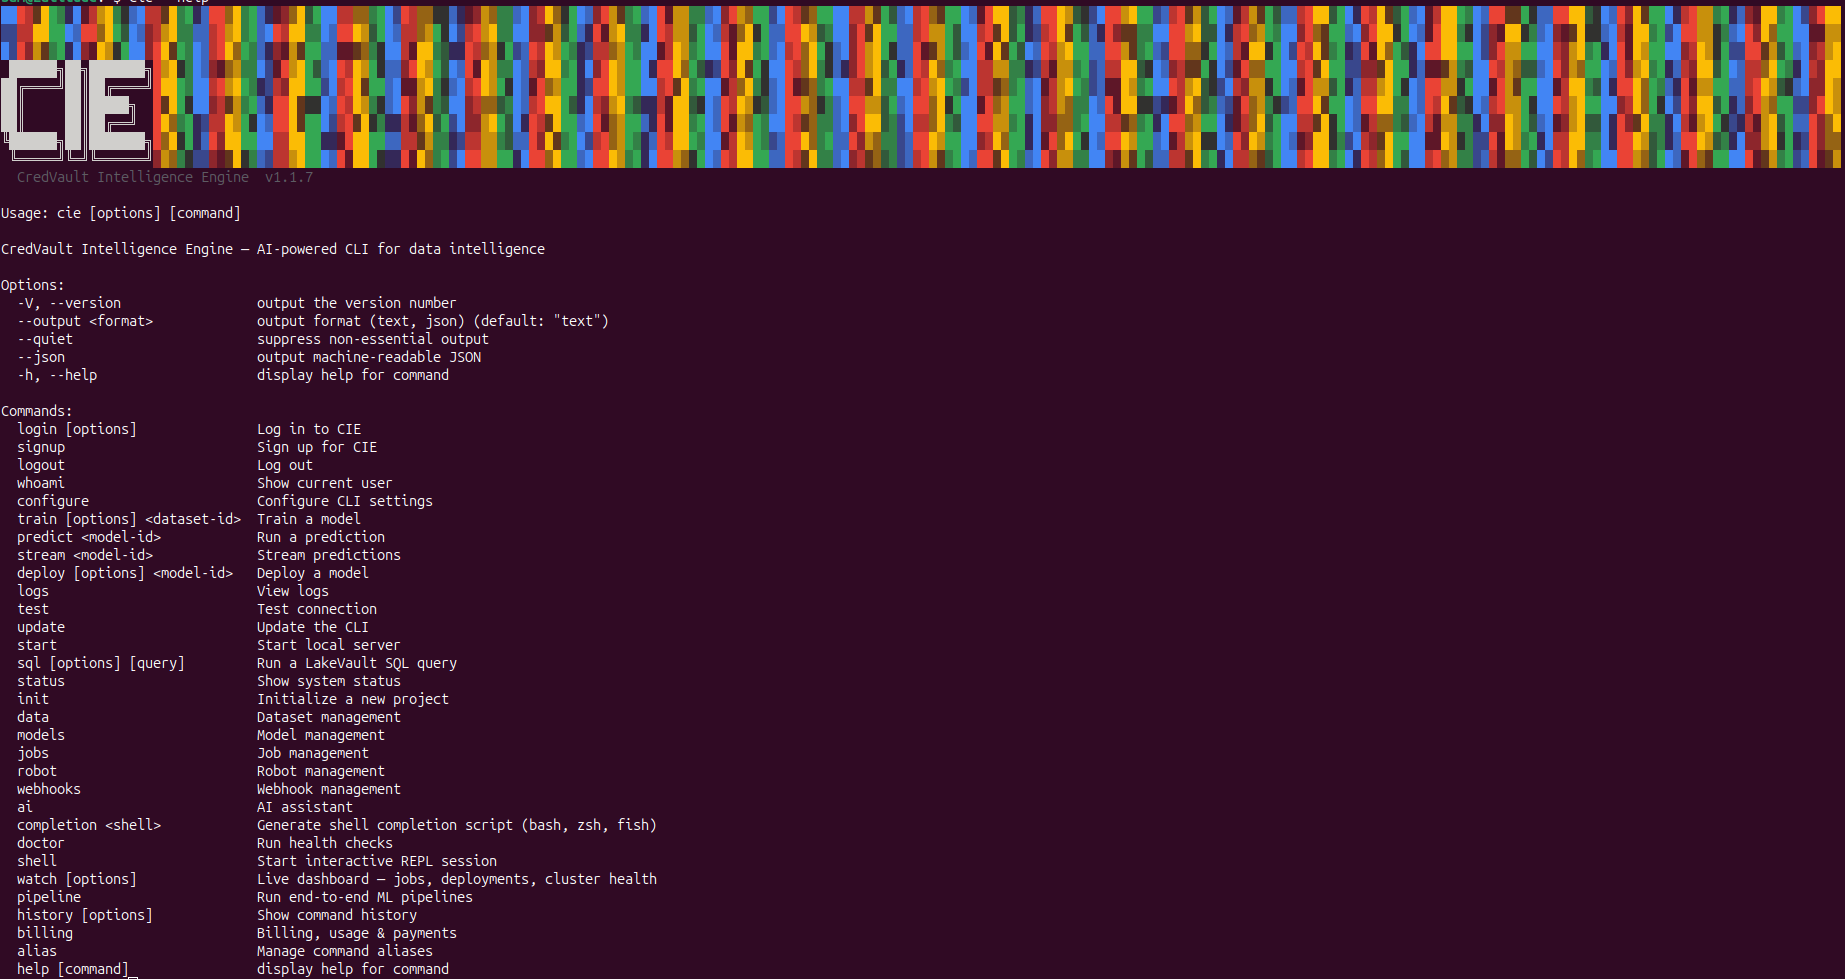
The cie CLI is the CredVault Intelligence Engine command-line tool. It gives you complete access to your platform from the terminal — authenticate, manage data, train and deploy ML models, query your database with SQL, monitor live metrics, manage billing, control robots, and chat with Vault AI.
Installation
npm install -g credvault-cie
Requires Node.js 18 or higher. Once installed, run cie to see the welcome screen.
Authentication
Everything starts with logging in.
cie login
You'll be prompted for your email and password. Your session is stored locally and expires after 7 days.
Create an account from the CLI:
cie signup
The signup flow walks you through creating your account, accepting terms, and choosing a billing plan — all without leaving the terminal.
Check your current session:
cie whoami
Configure defaults (cluster, region, environment, API URL):
cie configure
Log out:
cie logout
Interactive Shell
Instead of typing cie before every command, you can drop into an interactive shell:
cie shell
Inside the shell, type commands directly — login, ai, data upload ./file.csv, billing status — and use help to see all available commands grouped by category. Type exit to quit.
Vault AI
Talk to Vault AI directly from your terminal. It understands your platform context — clusters, models, robots — and can suggest fixes, explain errors, and run commands on your behalf.
Start a conversation:
cie ai
Ask a single question:
cie ai ask "why is my cluster latency high?"
Vault AI streams its response token by token. It supports multi-turn conversations — your session is remembered until you reset it.
Reset the conversation:
cie ai reset
Run an AI-powered diagnostic on your entire platform:
cie ai doctor
The doctor scans cluster health, recent activity logs, and robot connectivity. It reports issues and suggests specific cie commands to fix them. You can select which fixes to run interactively.
Data Management
Upload a dataset
cie data upload ./sales-data.csv
Supports CSV, JSON, and other tabular formats. The CLI shows file size and record count on completion.
List your datasets
cie data list
Analyze data quality
cie data quality <dataset-id>
Returns completeness, consistency, and validity scores, plus a breakdown of issues by field.
Get a quick quality score
cie data quality-score <dataset-id>
Returns a single score (0–100). Green is 80+, yellow is 50–79, red is below 50.
Delete a dataset
cie data delete <dataset-id>
Prompts for confirmation. Use --force to skip the prompt.
Model Training
Train a model on a dataset
cie train <dataset-id> --name "Churn Predictor" --type classification
Supported model types: classification, regression, clustering, timeseries.
The CLI returns a job ID immediately. Training runs in the background.
Monitor training progress
cie jobs status <job-id>
List all your models
cie models list
Shows model ID, name, status, accuracy, and training date.
View model details and metrics
cie models info <model-id>
Returns accuracy, precision, recall, dataset used, and total predictions made.
Compare two model versions
cie models compare <model-id-1> <model-id-2>
View version history
cie models versions <model-id>
Roll back to a previous version
cie models rollback <model-id> <version>
Export a model
cie models export <model-id> --output ./my-model.zip
Predictions
Run a single prediction
cie predict <model-id> --data '{"age": 34, "plan": "starter"}'
Or pass input from a file:
cie predict <model-id> --file ./input.json
Returns the prediction result and confidence score.
Stream real-time predictions via WebSocket
cie predict stream <model-id>
Opens a live WebSocket connection. Every prediction event is printed as it arrives — result, confidence, and probability breakdown. Press Ctrl+C to stop.
Full ML Pipeline
Run the complete workflow — upload, train, deploy — in one command:
cie pipeline run --file ./data.csv --name "Revenue Model" --type regression --env production
If you omit any flags, the CLI prompts you interactively. The pipeline shows each step as it completes:
✓  Dataset uploaded     ds_abc123
✓  Training started     job_xyz789
✓  Training complete    model_def456
✓  Deployed             dep_ghi012
   Endpoint:            https://api.credvault.net/cie/predict/dep_ghi012
Export your pipeline config
cie pipeline export > pipeline.json
Dumps all your models and deployments as a JSON config you can version-control or share.
Model Deployment
Deploy a model
cie deploy <model-id> --env production
Returns a deployment ID and a live API endpoint.
List all deployment jobs
cie deploy jobs
Check a specific job
cie deploy status <job-id>
SQL — LakeVault SQL Engine
Query your database collections using SQL directly from the terminal.
Run a query
cie sql "SELECT name, email FROM users WHERE active = true LIMIT 20"
Results are rendered as a formatted table in the terminal.
Interactive SQL REPL
cie sql --interactive
Opens a persistent SQL shell. Type queries and press Enter. Type .exit to quit.
sql › SELECT COUNT(*) FROM orders WHERE status = 'completed'
sql › SELECT users.name, SUM(orders.total) FROM users JOIN orders ON users._id = orders.user_id GROUP BY users.name
sql › .exit
API Keys — Test from the CLI
You can test your API keys directly without leaving the terminal. Use cie configure to set your API URL, then any command that hits the backend will use your key automatically.
To test a specific key manually:
curl -H "Authorization: Bearer <your-api-key>" https://credvault-production.up.railway.app/api/clusters
Or use the interactive shell to run commands against your live cluster:
cie shell
cie> sql "SELECT * FROM your_collection LIMIT 5"
cie> data list
cie> models list
Everything in the shell runs against your authenticated account — same as the dashboard, same as the API.
Webhooks
List webhooks
cie webhooks list
Create a webhook
cie webhooks create
Prompts for name, target URL, and events to subscribe to (insert, update, delete, replace).
Test a webhook
cie webhooks test <webhook-id>
Sends a test event and shows the HTTP status code and response time.
Delete a webhook
cie webhooks delete <webhook-id>
Robotics & IoT
Connect to a device
cie robot connect <robot-id>
Stream live telemetry
cie robot monitor <robot-id>
Opens a WebSocket stream. Prints battery, temperature, CPU, memory, and GPS location as they arrive in real time.
Simulate telemetry (for testing)
cie robot simulate <robot-id>
Sends randomized telemetry data every second — useful for testing your dashboard and webhooks without a physical device.
Sync workspace
cie robot sync
Syncs your local workspace with the cloud — datasets, models, and configs.
Live Dashboard
cie watch
Opens a live terminal dashboard that refreshes every 3 seconds. Shows:
- Cluster health and system stats
- Active and recent jobs with progress bars
- Deployments and their status
Press Ctrl+C to exit. Use --interval <seconds> to change the refresh rate.
Billing
View your plan and current usage
cie billing status
Shows your plan, trial days remaining, credits, payment method, per-category spend (storage, requests, bandwidth, compute, AI inference, seats), and projected end-of-month cost.
Get a cost estimate
cie billing estimate
List invoices
cie billing invoices
View a specific invoice
cie billing invoice <invoice-number>
Add or update a payment method
cie billing setup
Opens Payments in your browser. Supports card (Visa, Mastercard) and bank transfer via a dedicated virtual account. The CLI polls for confirmation automatically.
Set a monthly spending limit
cie billing limit --set 50
Caps your monthly spend at $50. Use --off to disable.
Upgrade your plan
cie billing upgrade
Prompts you to choose: Free, Starter ($5/mo), Team ($29/mo), or Pay-as-you-go.
Cancel your subscription
cie billing cancel
System & Diagnostics
Check platform health
cie status
Run a full diagnostic
cie doctor
View command history
cie history
Check for updates
The CLI checks for new versions automatically. Update manually with:
npm update -g credvault-cie